
The Switching Cost Scorecard
Which businesses are hardest to leave — and why it matters for investors.
Section 1
The Analytical Framework
What switching costs actually are
Switching costs exist when the cost — in time, money, operational disruption, or risk — of moving from one vendor to another exceeds the benefit the customer would receive from doing so. This is not brand loyalty. It is not preference. It is the structural lock-in that makes a rational customer stay even when alternatives exist on paper.
The investor implication is profound. Businesses with high switching costs can raise prices above inflation without losing customers. They earn returns on invested capital well above their cost of capital for extended periods. And they compound intrinsic value at rates that look impossible to a market focused on near-term multiples and quarterly comparisons. The single most underappreciated source of long-term return in public equities is the slow, mechanical reality of customers who cannot leave.
The Five Sources of Switching Costs
Financial switching costs are the direct costs of migration — licensing fees, implementation expenses, data conversion, contract termination penalties. The most common example is a multi-year enterprise software contract layered on top of a one-time implementation project that ran into the millions of dollars; the sunk cost is gone but the prospect of repeating it kills any switching conversation before it starts.
Procedural switching costs are the time and effort needed to learn a new system, retrain staff, and rebuild workflows. A hospital replacing its patient management system measures the procedural cost not in dollars but in months of clinical disruption and the very real risk of a patient-safety incident during the transition. No competing vendor’s pitch survives that calculation.
Relational switching costs are the loss of established relationships, institutional knowledge, and trust built over years. An insurance company’s relationship with the analyst team that rates its securities at S&P Global is a relational asset constructed over decades; the relationship is not transferable, and the cost of rebuilding it with a new agency is paid in market access.
Technical switching costs are the depth of integration between the vendor’s product and the customer’s own systems — APIs, data formats, embedded workflows. A large enterprise running ServiceNow across fifty connected workflows does not face the cost of replacing one system; it faces the cost of replacing fifty, simultaneously, without breaking the business.
Regulatory switching costs are compliance requirements tied to a specific vendor’s product or certification. A county government running Tyler Technologies’ court case-management system may need formal regulatory re-approval for any replacement; the procurement office that owns the budget rarely volunteers for that exposure twice in a career.
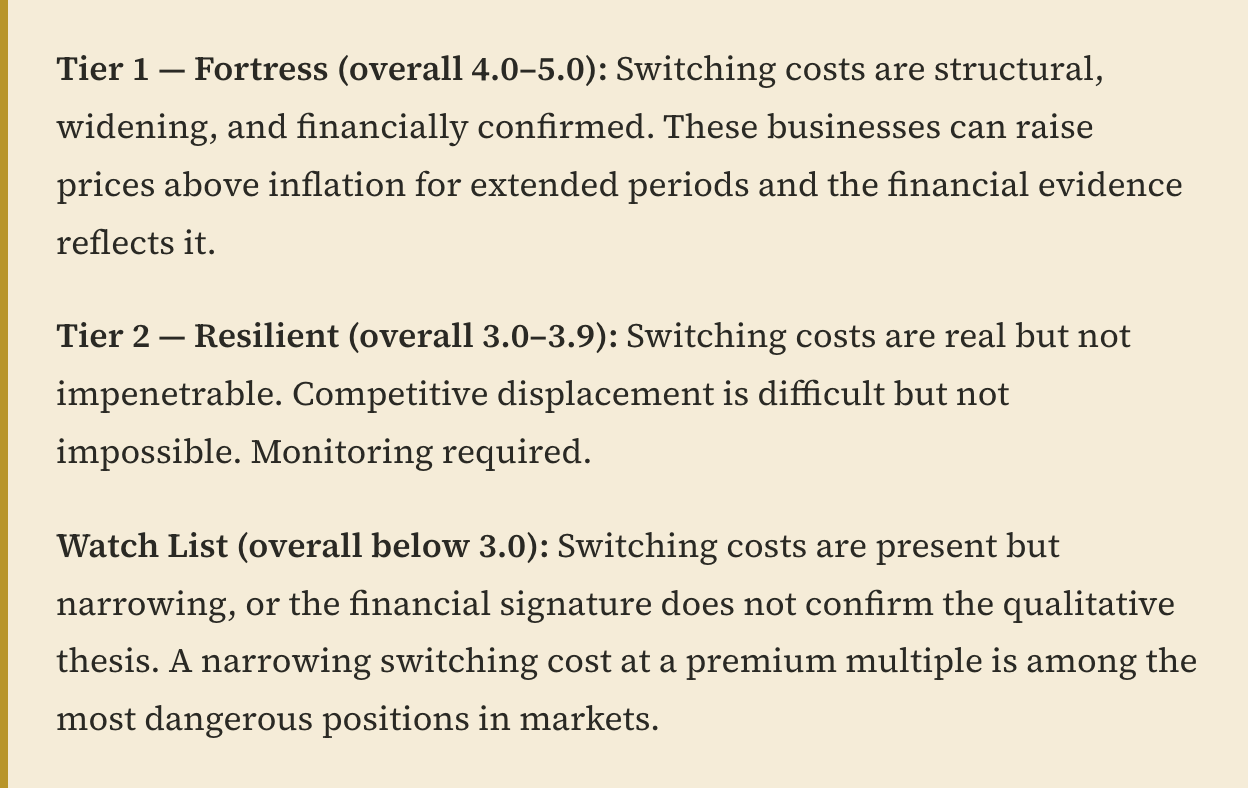
The Scoring Methodology
Each company in this report is scored on four dimensions. The same evidence standard is applied to every name. Scores are rounded to one decimal place and reflect the most recent verifiable filings and disclosures.
Depth (1–5) measures how high the switching cost is in absolute terms. A score of five means switching is functionally impossible for most customers. A score of three means it is materially difficult but not prohibitive.
Breadth (1–5) measures how many of the five switching-cost types are present. A score of five means all five sources operate simultaneously, layered on top of one another. A score of three means two or three of the types apply meaningfully.
Durability (1–5) measures whether the switching cost is stable, widening, or narrowing. A score of five means it is structural and widening — every year of customer usage makes a future switch harder. A score of one means it is eroding, typically because AI-native alternatives are collapsing the procedural cost of switching.
Financial Signature (1–5) measures whether the financial evidence confirms the qualitative thesis. The relevant inputs are net revenue retention or renewal rate, customer churn, return on invested capital relative to cost of capital, and demonstrated pricing power. A score of five means all four metrics align with exceptional switching-cost strength. A weak financial signature against strong qualitative claims is a warning, not an excuse.
The overall score is the simple average of the four dimensions.
Section 2
Ten Businesses, Four Dimensions, One Standard
The universe below is constructed for analytical contrast: enterprise software with deep technical integration sits next to physical-asset networks; ratings franchises sit next to payment networks; and a single aerospace name sits next to all of them — a deliberate test of whether the switching-cost lens applies as cleanly to regulatory certification and 30-year aircraft platforms as it does to workflow embedding. The companies were selected because the switching-cost evidence is specific, verifiable, and varied — not because the names are familiar. Each profile is focused exclusively on the switching-cost lens. Full moat, financial-quality, and valuation analyses are addressed in the linked deep-dives.
