
What Is Owner Earnings — The Metric Warren Buffett Actually Uses
Most serious investors have abandoned earnings per share. Many have settled on free cash flow. Both stop one layer short. Owner earnings measures what a business genuinely produces for its owners.
The first piece in this series showed why EPS misleads — why a number shaped by depreciation schedules, share counts, and tax timing can rise while a business stagnates, or fall while it strengthens.

This piece goes one layer deeper. It shows why even free cash flow, as reported, can mislead — and introduces the metric that removes the remaining distortion. The worked example that follows is a complete, line-by-line calculation for a real business, with every figure drawn from its most recent verified financial statements.
Section 1
The Problem
Why Free Cash Flow, As Reported, Is Not Enough
Most investors who take their craft seriously have already abandoned earnings per share. They have learned that EPS is an accounting construct — shaped by depreciation schedules, share counts, tax timing, and one-time charges — and that it can rise while the underlying business stagnates or decline while the business strengthens. The case against EPS has been made before, and made in detail. The investors who have absorbed it have moved on to a better metric: free cash flow. This is genuine progress. It is also not enough.
Reported free cash flow — operating cash flow minus total capital expenditure — carries a specific, structural distortion. It treats every dollar of capital spending identically. A company that spends $500 million replacing aging equipment, refreshing existing technology, and sustaining current capacity, and a company that spends $500 million building a new factory designed to generate returns for the next twenty years, produce the same reported free cash flow figure. But these are not the same kind of spending. The first is a cost of staying in business. The second is a discretionary investment in growth. Treating them as one number understates the earnings power of high-quality businesses that are investing heavily to expand, and overstates the earnings power of capital-intensive businesses that are merely standing still.
Warren Buffett identified this distortion four decades ago. In his 1986 Berkshire Hathaway shareholder letter, he defined a metric he called owner earnings — a measure built specifically to capture the cash a business genuinely produces for its owners after it has spent what is required to maintain its competitive position, but before it spends on growth. The concept has appeared in his writing ever since. It is one of the most cited ideas in investing. It is also, in practice, one of the least applied. Wall Street still anchors on EPS and reported free cash flow because both can be pulled directly from the financial statements without judgment. Owner earnings cannot.
Owner earnings requires one judgment call — separating maintenance from growth capital expenditure — that most investors are unwilling to make. That unwillingness is the edge.
That gap between how often the concept is cited and how rarely it is calculated is the opportunity. Owner earnings is not a complicated idea. It requires one judgment call that most investors are unwilling to make.
The case for return on invested capital over EPS has already been made in detail in a companion piece on ROIC. Owner earnings is the next layer. ROIC identifies which businesses generate exceptional returns on the capital they deploy; owner earnings translates that quality into a specific dollar figure — what the business actually puts in its owners’ pockets.
Section 2
The Definition
What Owner Earnings Actually Measures
The formula is short. It is the reasoning behind each line that matters.
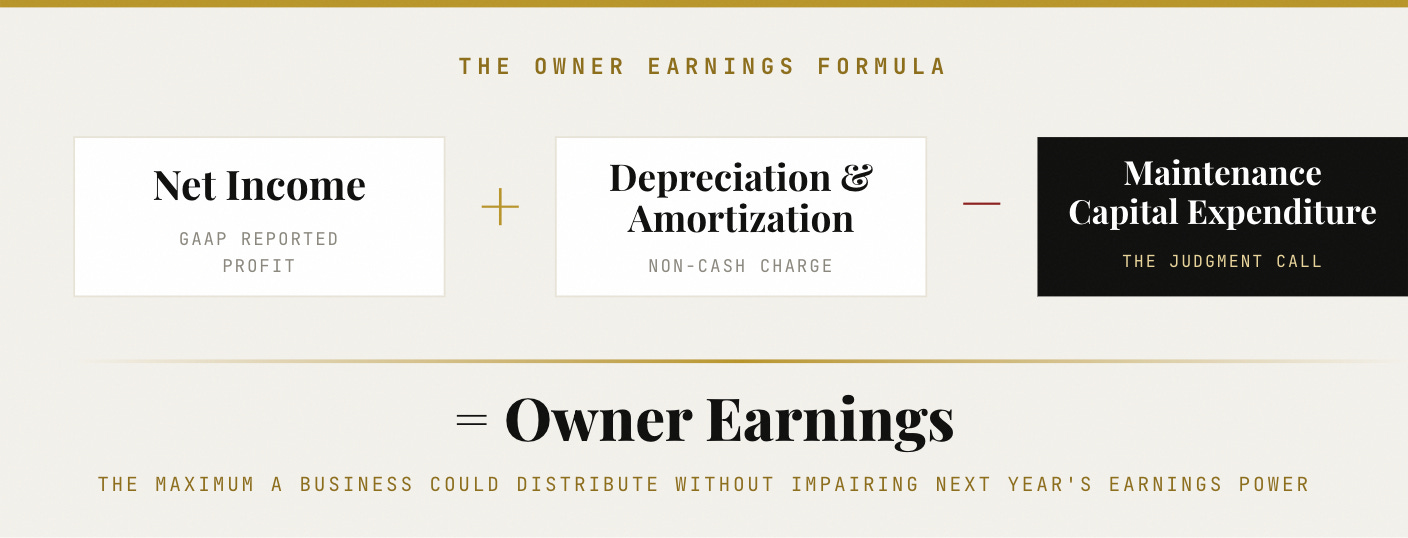
Buffett’s 1986 definition, expressed as a build.
Net Income. The starting point is GAAP reported net income — the accounting measure of profit, with all of its limitations. It already reflects financing costs, taxes, and every non-cash charge the accounting system imposes. Owner earnings begins here not because net income is accurate, but because it is the most widely understood baseline. Each subsequent adjustment is easier to follow when it starts from a number every investor already recognizes.
Plus Depreciation and Amortization. D&A is added back because it is a non-cash charge. It reduces reported earnings in the current period without removing any cash from the business in that period — it is an accounting estimate of how much of the company’s past capital spending was “used up” during the year. Adding it back converts the measure from an accounting profit figure to a cash-based one. This is the identical adjustment that appears at the top of every company’s operating cash flow statement.
Minus Maintenance Capital Expenditure. This is the critical line, and the contested one. Maintenance capex is the capital a business must spend to keep its existing asset base and competitive position intact at current volumes. It is the real, recurring cash cost of standing still. In economic terms it is the true counterpart to depreciation — the actual cash a business must lay out to replace what its operations consume. Where depreciation is an accounting estimate of asset consumption, maintenance capex is the cash reality of it.
Owner earnings deliberately excludes growth capital expenditure — spending on new capacity, new locations, new products, or acquisitions intended to expand the business. This is not because growth capex is unimportant; for a compounder, it is the single most important use of capital. It is excluded because growth capex is discretionary. Management can choose to reinvest in growth, or it can return that capital to owners. Maintenance capex offers no such choice. It is the non-negotiable minimum required to sustain current earnings power.
The result is a precise and useful number. Owner earnings is the maximum amount a business could distribute to its owners in a given year without impairing its ability to generate the same level of earnings the following year. It is the true sustainable earnings power of the business, measured independently of how management happens to allocate the surplus. Buffett’s original 1986 formulation made exactly this point: he described owner earnings as reported earnings plus depreciation and amortization, less the capital expenditures required to maintain the business’s competitive position and unit volume. He noted plainly that this figure often differs sharply from reported earnings — particularly for capital-intensive businesses — and that it is the figure that matters for valuation.
Section 3
The Calculation
The Judgment That Most Investors Avoid
There is a practical obstacle, and it is the reason owner earnings is cited far more often than it is calculated: maintenance capital expenditure is not disclosed. Financial statements report total capital expenditure — maintenance and growth combined into a single line. Pulling the two apart requires an estimate, and an estimate requires judgment.
This is precisely why most investors avoid it. Reported free cash flow uses total capex and requires no judgment. EBITDA ignores capex entirely and requires even less. Both metrics persist not because they are more accurate than owner earnings — they are less accurate — but because they are frictionless. Owner earnings asks the analyst to make one honest estimate and stand behind it. That friction is the edge: a metric that everyone could calculate but few will is, by definition, a source of differentiated insight.
There are four methods for estimating maintenance capex, in rough order of reliability.
The first is management disclosure. Some companies — particularly in capital-intensive industries such as oil and gas, industrials, railroads, and real estate — break out maintenance and growth capex separately, either in their filings or their investor presentations. Where this disclosure exists, it should be used without modification. It is the most reliable input available, because management has the asset-level detail that an outside analyst can only approximate.
The second is depreciation as a proxy. Depreciation is the accounting system’s own estimate of how much of the asset base was consumed during the period. For an established business operating at steady state, maintenance capex tends to approximate depreciation over time — the company spends roughly what its assets wear out each year to keep them intact. This method is conservative in one direction: in inflationary environments, the cash cost of replacing an asset can exceed its original cost, so depreciation may slightly understate true maintenance capex. But as a default estimate for a stable, asset-light business, it is reasonable and defensible.
The third is industry analysis. For businesses whose assets have known useful lives and replacement costs, maintenance capex can be reconstructed from the asset base itself. A vehicle fleet operator replaces a predictable percentage of its fleet each year at current prices. A retailer refreshes its stores on a defined cycle. The structure of the industry often reveals the maintenance requirement directly, independent of what the company chooses to disclose.
The fourth is management commentary. Earnings call transcripts and investor day presentations frequently contain qualitative discussion of maintenance versus growth spending, even when the formal statements do not separate them. Terms such as “stay-in-business capex,” “maintenance capex,” and “sustaining capex” recur in management discussion and can be used to calibrate an estimate against management’s own framing.
The judgment is less fragile than it first appears. A range of plus or minus 20% on the maintenance capex estimate rarely changes the analytical verdict on whether a business is a quality compounder. The businesses that look exceptional on owner earnings look exceptional across a wide band of assumptions; the businesses that look mediocre look mediocre across the same band. The judgment sharpens a valuation — it rarely reverses a conclusion.
Section 4
The Worked Example
Owner Earnings in Practice — A Real Calculation
Most treatments of owner earnings define the metric and stop. The definition is the easy part. What follows is a complete, line-by-line calculation for a real business, with every figure sourced from the company’s most recent verified financial statements and the maintenance capex method stated explicitly.
The business is Visa, for its fiscal year ended September 30, 2025. Visa is a useful subject because it is close to a pure case: a global payment network that owns very little physical plant, carries an enormous installed technology base, and converts revenue to cash at a rate few businesses on earth can match. It is exactly the kind of company for which the distinction between reported metrics and owner earnings becomes visible.
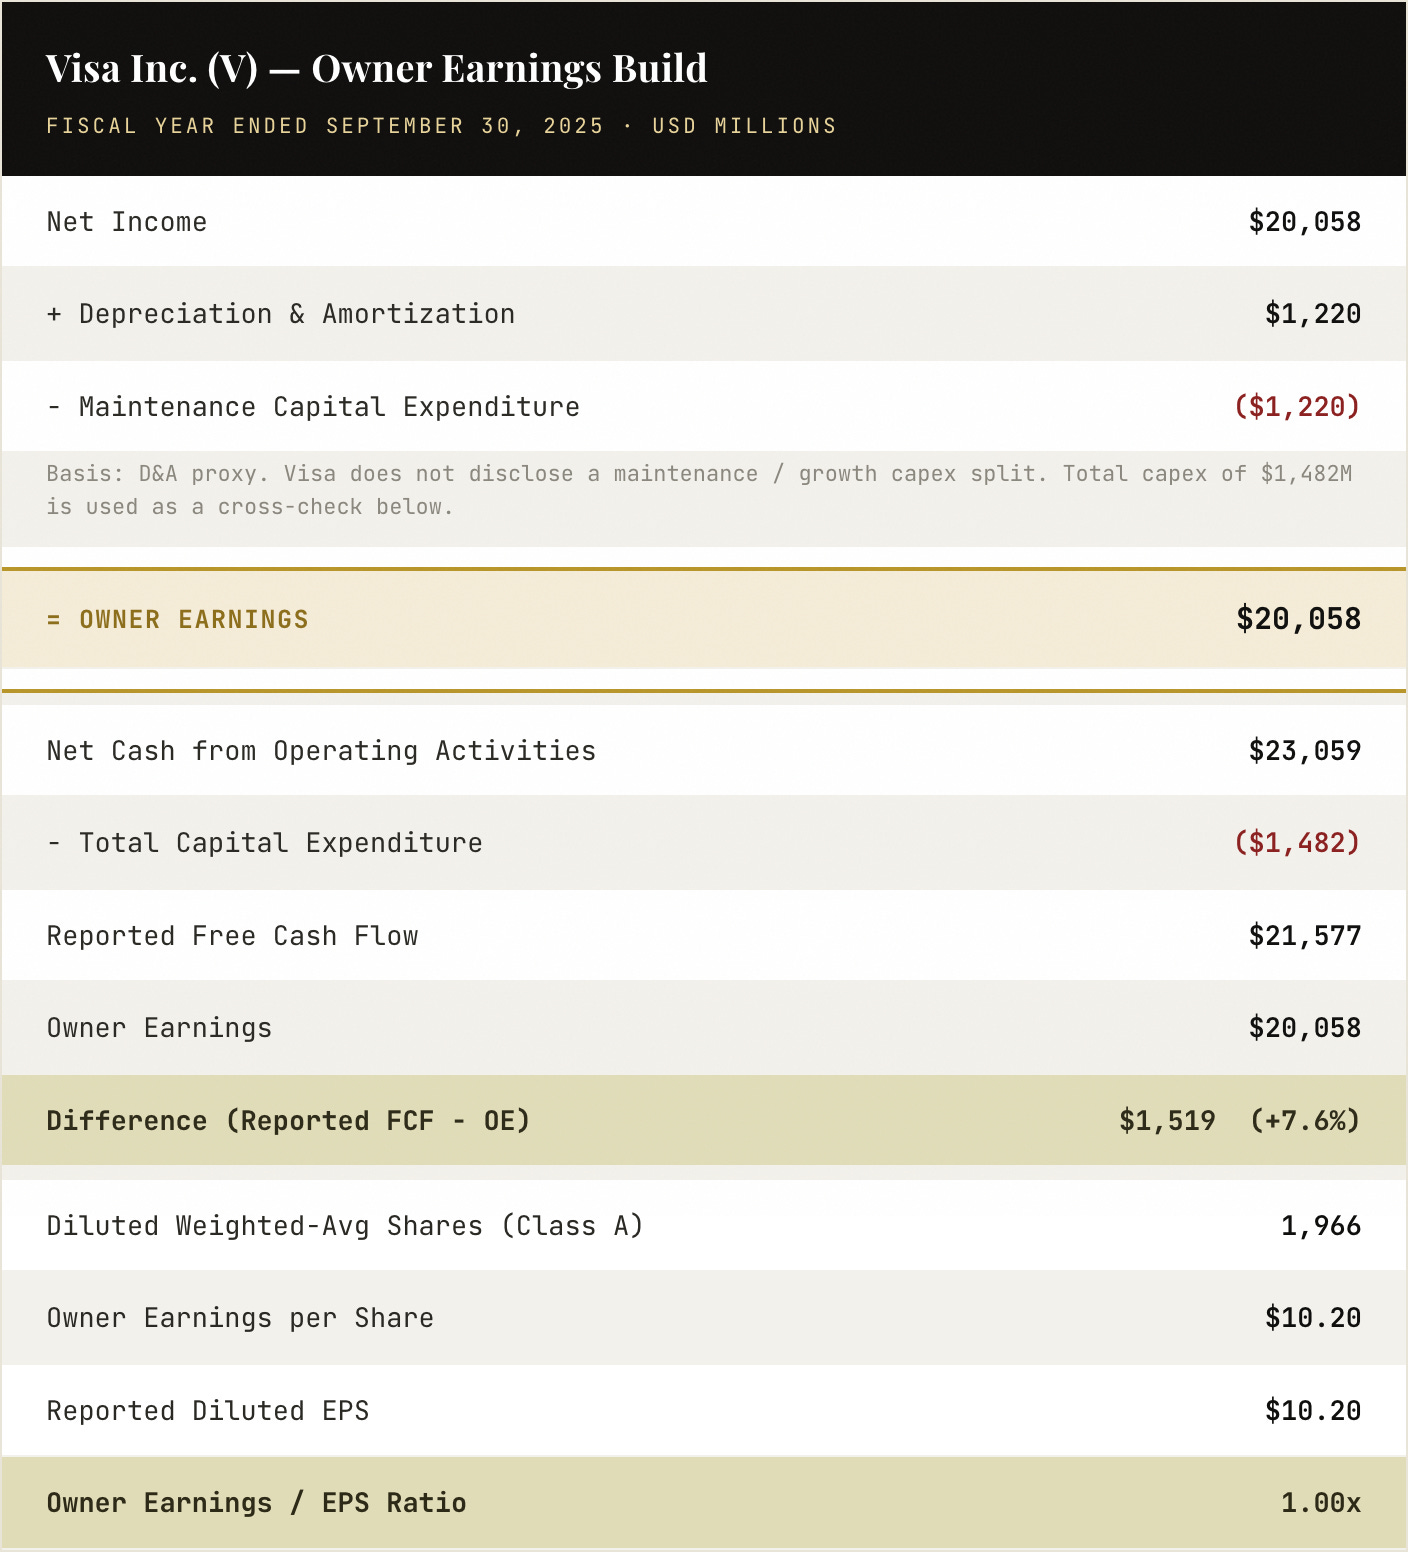
All figures are taken from Visa’s fiscal full-year 2025 results: net income, depreciation and amortization, operating cash flow, and capital expenditure from the consolidated statements of cash flows and operations; the diluted Class A share count from the consolidated statements of operations.
The maintenance capex estimate uses the depreciation-proxy method, and the reason is worth stating. Visa does not break out maintenance versus growth capex, so management disclosure is unavailable. The company’s total capital expenditure — “purchases of property, equipment and technology” — was $1,482 million for the year. Its D&A charge was $1,220 million. Because total capex modestly exceeds D&A, Visa is spending somewhat more than its assets are depreciating; some portion of the $1,482 million is growth investment in network capacity and technology. Using D&A as the maintenance estimate therefore produces a conservative, defensible figure: it assumes maintenance capex equals the rate at which the existing asset base is consumed, and leaves the $262 million difference as growth spending excluded from owner earnings.
This produces a result that is more honest, and more instructive, than the version found in most owner earnings articles. Those articles tend to present owner earnings as a number that comfortably exceeds reported free cash flow. Here it does the opposite. Visa’s owner earnings of $20.06 billion sits 7.6% below its reported free cash flow of $21.58 billion. The reason is straightforward: reported free cash flow subtracts only total capex, but operating cash flow for the year ran well above net income on favorable working capital movements, while the owner earnings build is anchored to net income itself. The lesson is that owner earnings is not a device for producing a flattering number. It is a discipline for producing an accurate one. For a business like Visa, owner earnings, reported FCF, and reported EPS all converge within a narrow band — and that convergence is itself the finding.

That convergence is the signature of an exceptional business. When net income, free cash flow, and owner earnings all land within roughly 8% of one another, it means the accounting is not hiding anything. There is no large gap between reported profit and real cash, no maintenance burden quietly consuming earnings, no aggressive capitalization inflating the income statement. The reported numbers can be trusted because the business is genuinely as capital-light as it appears. Total capex of $1,482 million represents under 4% of Visa’s $40.0 billion in net revenue — a maintenance requirement so modest that it barely moves the analysis.
On valuation, the owner earnings per share figure of $10.20 against a share price of roughly $329 implies an owner earnings yield near 3.1%, and a multiple above 32 times. That is not a cheap multiple, and owner earnings does not pretend otherwise. What owner earnings establishes is that the $10.20 is real — it is cash the business could distribute without impairing next year’s earnings power, not an accounting figure flattered by depreciation timing or capitalized costs. Whether 32 times genuine owner earnings is an attractive entry price depends entirely on the durability and growth rate of those earnings, which is the work of a full deep-dive rather than an educational piece.
The complete owner earnings build, the ROIC analysis, and the bear, base, and bull price targets for Visa are available to paid subscribers in the Quality Equities head-to-head that examined Visa against its closest network peer.

Section 5
The Conversion Rate
What Owner Earnings Reveals About Business Quality
The single most useful diagnostic that owner earnings produces is the owner earnings conversion rate — owner earnings divided by reported net income. It answers a question no single accounting figure can: does this business’s reported profit understate or overstate the cash it genuinely generates for owners?
A business that consistently converts net income to owner earnings at a ratio above 1.0x is a capital-light compounder. Its reported earnings understate its true earnings power, because its maintenance capital requirements are smaller than the depreciation charges dragging down its income statement. A business that converts below 1.0x is more capital-intensive than its reported earnings suggest — the cash it must spend to stand still exceeds the depreciation the accounting system records, so reported profit overstates what owners actually receive.
Three broad categories illustrate the spectrum.
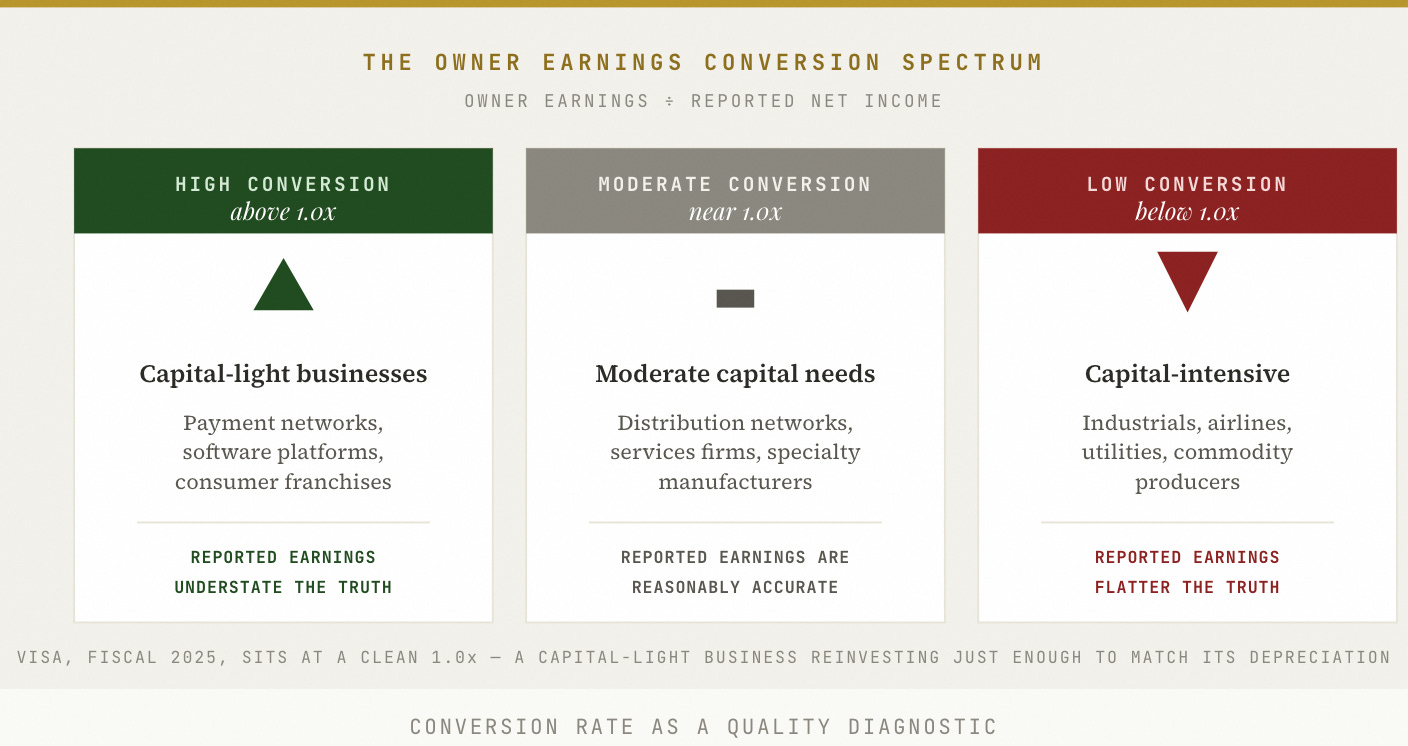
High conversion, above 1.0x. Capital-light businesses — payment networks, software platforms, consumer franchises with minimal physical assets. Depreciation and amortization are meaningful, often inflated by past acquisitions, but the cash needed to maintain the asset base is minimal. Owner earnings runs above reported net income. Each dollar of accounting profit understates what the business produces for owners.
Moderate conversion, near 1.0x. Businesses with genuine but manageable capital requirements — distribution networks, services firms, specialty manufacturers with well-maintained plants. D&A and maintenance capex roughly offset each other. Owner earnings approximates reported net income, and the accounting measure is, for once, reasonably accurate. Visa in fiscal 2025 sits here at a clean 1.0x — the rare case where a capital-light business is reinvesting just enough in network and technology that its maintenance requirement matches its depreciation.
Low conversion, below 1.0x. Capital-intensive businesses — industrials, airlines, utilities, commodity producers. Maintenance capex runs well above D&A because the cash cost of replacing an asset today exceeds its decades-old original cost on the books. Owner earnings falls materially below reported net income. The accounting flatters the true economics, sometimes severely.
The valuation consequence is the part the market routinely ignores. Two businesses trading at an identical price-to-earnings multiple can be worth very different amounts on an owner earnings basis. The capital-light business with high conversion deserves the higher multiple, because each dollar of its reported earnings understates the cash available to owners. The capital-intensive business with low conversion deserves the lower one, for the opposite reason. A market that prices both on the same P/E systematically overvalues the capital-intensive business and undervalues the capital-light one. Owner earnings conversion is the correction.
This connects directly back to return on invested capital. The businesses with the highest owner earnings conversion rates are almost always the same businesses with the highest ROIC — and this is not a coincidence. Capital-light economics produce both outcomes simultaneously: a business that needs little capital to operate will both earn a high return on the capital it has deployed and convert its reported profit into owner earnings at a high rate. ROIC measures the efficiency of the engine. Owner earnings measures the output the engine produces. Read together, as argued in the ROIC piece, they form a far more complete picture of business quality than either provides alone.
Section 6
The Per Share Discipline
Why Owner Earnings per Share Is the Right Unit
Owner earnings as an absolute number is useful. Owner earnings per share, tracked over time, is what actually matters to an investor — because an investor does not own a business, an investor owns a fractional claim on it, and the size of that claim changes.
Consider a business that grows its absolute owner earnings by 15% annually while issuing new shares equal to 5% of its float each year through stock-based compensation. The business is expanding. The owner’s claim on it is expanding far more slowly — at roughly 10% per share, not 15%. The per share discipline is the line that separates genuine compounding from growth that is quietly funded by diluting the existing owners. An investor who tracks only the absolute figure will mistake the second for the first.
Three specific distortions make the per share calculation indispensable.
The first is stock-based compensation. SBC is a real cost borne by existing shareholders, even though no cash leaves the business when it is granted. When a company pays its employees in shares, it transfers a slice of ownership — and therefore a slice of all future owner earnings — from existing holders to employees. Owner earnings per share, calculated on the fully diluted share count that includes options, restricted stock units, and convertible instruments, captures this dilution automatically.
A Verified Example — Workday
Workday shows the distortion in its undiluted form. In its fiscal year ended January 31, 2025, Workday recorded $1.52 billion of share-based compensation — roughly 18% of its $8.45 billion in revenue, an unusually large annual transfer of ownership to employees. The company repurchased $700 million of its own stock over the same year, but that was less than half the value of the grants. The result is visible directly in the share count: diluted weighted-average shares rose from 265.3 million in fiscal 2024 to 269.2 million in fiscal 2025, a roughly 1.5% increase. Existing owners ended the year holding a smaller slice of the business than they started with. Any growth in Workday’s absolute owner earnings is therefore divided across a steadily expanding share base — and owner earnings per share grows more slowly than the headline figure. Only the per share lens makes that erosion visible. Figures are from Workday’s fiscal 2025 financial statements.
A business reporting strong owner earnings growth on a per-share basis, despite heavy SBC, is genuinely compounding. A business such as Workday, where the diluted share count is rising because buybacks do not fully offset the grants, is funding part of its operations by handing ownership away — and the per share figure is what reveals it. The contrast with Visa is instructive: Visa carried $897 million of SBC in fiscal 2025, yet its diluted share count fell, because buybacks more than absorbed the dilution. Same line item, opposite outcome for the owner. The per share calculation is what separates the two.
The second is debt-funded buybacks. A company can lift owner earnings per share simply by repurchasing shares with borrowed money. The per share figure improves; so does the per share burden of debt and the per share exposure to refinancing risk. Per share growth produced by leverage is not equivalent to per share growth produced by operating performance, and the two should never be read as the same thing. Any assessment of owner earnings per share growth must be cross-referenced against the trend in net debt.
The third is acquisitions. An acquisitive company can grow absolute owner earnings quickly while owner earnings per share grows slowly, if those acquisitions are paid for with stock. The reverse is also possible: a disciplined acquirer buying businesses below intrinsic value with cash can grow owner earnings per share faster than absolute owner earnings. The per share lens reveals which kind of acquirer is at work — the one creating value for owners, or the one merely creating a larger company.
This is where owner earnings becomes a valuation tool rather than a diagnostic one. Owner earnings per share, compounded at a sustainable rate, is the foundation of intrinsic value per share. A business compounding owner earnings per share at 15% a year doubles its intrinsic value roughly every five years. At 20%, roughly every 3.6 years. The entry price and the holding period then determine how much of that compounding accrues to the buyer rather than to the seller — which is the entire game.
Section 7
The Framework
Applying Owner Earnings in Practice
Owner earnings is most useful when treated as a three-part tool, applied at three different stages of analysis.
The first use is as a screening filter. Owner earnings per share divided by the current share price gives an owner earnings yield — an immediate, judgment-light valuation reference. It can be compared to the yield on the 10-year Treasury and to the owner earnings yield of the broad market. A business offering an owner earnings yield well below the risk-free rate is priced for substantial future growth, and that growth becomes the thing that must be verified. A business offering a yield above the market average may be mispriced — but only if the quality of those earnings holds up under scrutiny, because a high yield on low-quality, eroding earnings is a trap rather than a bargain.
The second use is as a quality signal. The owner earnings conversion rate — owner earnings over reported net income — is the fastest quality read available in a ten-minute look at a business. A ratio consistently above 1.0x points to capital-light economics and, almost always, high ROIC. A ratio consistently below 1.0x points to capital intensity that the income statement is not fully showing. The trend matters as much as the level: a conversion rate that is drifting downward is an early warning that capital intensity is rising, and it often appears in the conversion rate before it shows up in reported margins.
The third use is as a valuation input. Owner earnings, grown at an explicitly stated rate and discounted at the cost of equity, produces an intrinsic value estimate grounded in what the business genuinely generates for its owners — not in what accounting conventions report. Every Quality Equities deep-dive builds an owner earnings model across bear, base, and bull scenarios, with every assumption stated on the page. A valuation that does not state its owner earnings assumptions is not a valuation. It is a multiple applied to an accounting artifact, and it should be treated as one. The deep-dive research published here applies this discipline to specific names.
Owner earnings forces the harder question: after this business has spent what it must to maintain its competitive position, what is actually left for its owners?
The deepest value of owner earnings, though, is as a defense against motivated reasoning. When a business is compelling — when the narrative is strong, the growth is impressive, the management team is articulate on the call — it becomes very easy to accept reported earnings at face value and move on. Owner earnings refuses to allow it. It forces the harder question: after this business has spent what it must spend to maintain the competitive position that generates these earnings, what is actually left for its owners? The answer, expressed in dollars per share, is the number on which every other judgment depends.
Section 8
The Universe
The Businesses That Owner Earnings Reveals
Most public businesses fail the owner earnings test. They fail it not because their reported earnings are low, but because their maintenance capital requirements quietly consume a large share of what the income statement presents as profit. A manufacturer reporting a 15% net margin while spending 12% of revenue each year just to maintain its existing plant is a fundamentally different business from a software company reporting the same 15% net margin while spending 1% of revenue on maintenance. Their income statements look alike. Their owner earnings do not. The metric exists to make that difference visible.
The businesses worth studying on an owner earnings basis share one structural trait: their depreciation and amortization exceeds their maintenance capital expenditure, often by a wide margin. The accounting system depreciates assets that cost relatively little to keep in working order. And the most valuable assets these businesses own — a brand, a dataset, a payment network, an installed base of customer relationships, decades of institutional knowledge — were never capitalized at all, and so carry no depreciation charge whatsoever. These businesses report earnings that understate their true economics. Owner earnings is the correction, and it points consistently toward three categories.
The first is payment networks and financial infrastructure. Maintenance capex is minimal, the depreciation charge reflects a large historical technology base, and owner earnings runs at or above reported net income. Visa, examined above, is the cleanest available illustration: total capex below 4% of revenue, and owner earnings, free cash flow, and reported EPS all converging within a narrow band that confirms the accounting is hiding nothing.
The second is consumer brands and franchises. A great consumer brand is built on intangible assets — reputation, distribution, shelf presence, decades of advertising — that require very little physical capital to maintain. Depreciation, frequently inflated by amortization from past acquisitions, runs well above the modest cash needed to sustain the business. Owner earnings conversion is typically high, and the balance sheet, which carries the brand at a fraction of its real worth, understates the true asset base.
The third is enterprise software and data platforms. Server and infrastructure assets depreciate quickly on the books, but they are replaced at a steadily declining real cost as computing power grows cheaper. Maintenance capex is a fraction of the D&A charge. Owner earnings comfortably exceeds reported earnings — though here especially, the per share discipline is essential, because stock-based compensation in this category, as the Workday example showed, can dilute owners faster than the absolute figure suggests unless it is fully offset by disciplined buybacks.
Return on invested capital identifies which businesses are worth studying. Owner earnings quantifies what those businesses actually produce for their owners.
Return on invested capital identifies which businesses are worth studying. Owner earnings quantifies what those businesses actually produce for their owners. Together they form the two most important inputs to any serious long-term valuation. Everything else — the moat assessment, the evaluation of management, the test of competitive durability over a decade — determines how long those economics can be expected to persist. The paid research published here applies all three lenses to specific businesses, with explicit assumptions and specific price targets.
Quality Equities publishes independent research for informational purposes only. Nothing published constitutes investment advice or a recommendation to buy or sell any security. The author may hold positions in securities discussed.