
What Is a Moat? The Five Sources of Durable Competitive Advantage
Warren Buffett calls it a moat. It is one of the most important concept in investing. Here are the five sources of competitive advantage, how to identify them, and the one test most investors miss.
Return on invested capital identifies the businesses that create value. Owner earnings measures what owners actually receive. The moat framework explains why some businesses sustain those returns for decades while competition erodes them for everyone else. This is the third piece in the free educational framework, and the answer to the question the ROIC piece raised.
Section 1
The Problem
Why Most Investors Mistake Competitive Advantages for Moats
The word “moat” has become one of the most overused terms in investing, and that overuse has drained it of meaning. Investors apply it to any business with positive qualities — a strong brand, a beloved product, a loyal customer base, a clever founder. These are competitive advantages. They are not moats. The distinction is not pedantic, and getting it wrong is one of the most expensive errors in long-term investing, because competitive advantages erode and economic moats compound.
A competitive advantage describes a current state: the business is better than its rivals today. An economic moat describes a structural feature: a mechanism that makes the business harder to displace tomorrow than it is today, no matter how much capital a competitor deploys against it. A restaurant with excellent food has a competitive advantage — and a richer rival can open across the street and hire away the chef. Visa has a moat. The difference between the two is not one of degree. It is one of kind.
Warren Buffett popularized the economic moat in his Berkshire Hathaway shareholder letters, and his framing was deliberately literal: the moat is what protects the castle — the business — from attack by competitors. But the analogy carries further than most investors take it. A moat is not a fixed object. It can widen, hold steady, or narrow over time, and the direction of travel matters as much as the depth measured today. A deep moat that is filling in is a worse asset than a shallower one that is still being dug.
This is where the moat framework connects directly to return on invested capital. ROIC above roughly 20 percent is the financial signature of a moat — the empirical fingerprint it leaves behind. But ROIC alone cannot tell an investor whether those returns are protected by structure or merely the temporary reward of a good product cycle, defensible for a decade or vulnerable to the next well-funded entrant. The case for ROIC as the primary measure of business quality has already been made in full in the ROIC piece. This piece explains why some businesses sustain high ROIC for decades — and why most cannot.

There are exactly five structural sources of moats in business. Understanding them specifically, not abstractly, is the foundation of long-term investment analysis.
Section 2
The Definition
What a Moat Actually Is — and What It Is Not
An economic moat is a structural barrier that prevents competitors from eroding a business’s returns on invested capital over time, even when those competitors have full access to capital, talent, and the knowledge that the business is highly profitable. The decisive phrase is “even when.” A moat is not simply a reason the business is winning today. It is a reason that a rational, well-resourced competitor cannot easily close the gap, no matter how clearly it sees the opportunity.
The first test is the capital test. Could a competitor with effectively unlimited capital replicate the business’s market position within five years? If the answer is yes — or even a hesitant maybe — the moat is weak or absent, because capital is the most direct form of competitive attack and the market will eventually supply it. If the answer is no regardless of how much money is thrown at the problem, the moat is structural. A new entrant can fund the construction of a payment network. It cannot, in five years and at any price, recreate Visa’s six-decade accumulation of relationships spanning 4.6 billion payment credentials and more than 150 million merchant locations.
The second test is the returns test. Has the business sustained ROIC above its cost of capital for a decade or more, through real competitive pressure and at least one full economic cycle? Sustained high returns are the empirical evidence that a moat exists. A single year of high returns is luck, timing, or a favorable product cycle. A decade of high returns, defended through recessions and competitive assaults, is structure leaving its signature in the financial statements.
The third test is the displacement test. Has a well-resourced competitor tried to take this market — and failed? The history of failed competitive attacks is the most compelling moat evidence available, more persuasive than any narrative about why a business should be durable. Google, with near-limitless resources, repeatedly tried to insert itself into consumer payments and never displaced the card networks. Through the 1990s, every major technology company that attempted to dislodge Windows as the desktop standard discovered that the installed base, the developer ecosystem, and the retraining costs formed a barrier that superior engineering alone could not overcome.
Finally, the moat must be distinguished from the quality of the business itself. A company can be excellent — well-managed, fast-growing, highly profitable — and still lack a durable moat. A brilliant chief executive is not a moat; brilliance is mobile and mortal. A superior product is not a moat; products are copied. A loyal customer base built on a great product, where leaving would impose real cost, disruption, or risk on the customer, is the beginning of a moat. The moat is always the specific structural feature that makes the returns defensible, never the returns themselves.
Section 3
The Five Sources
The Only Five Structural Barriers That Create Durable Competitive Advantage
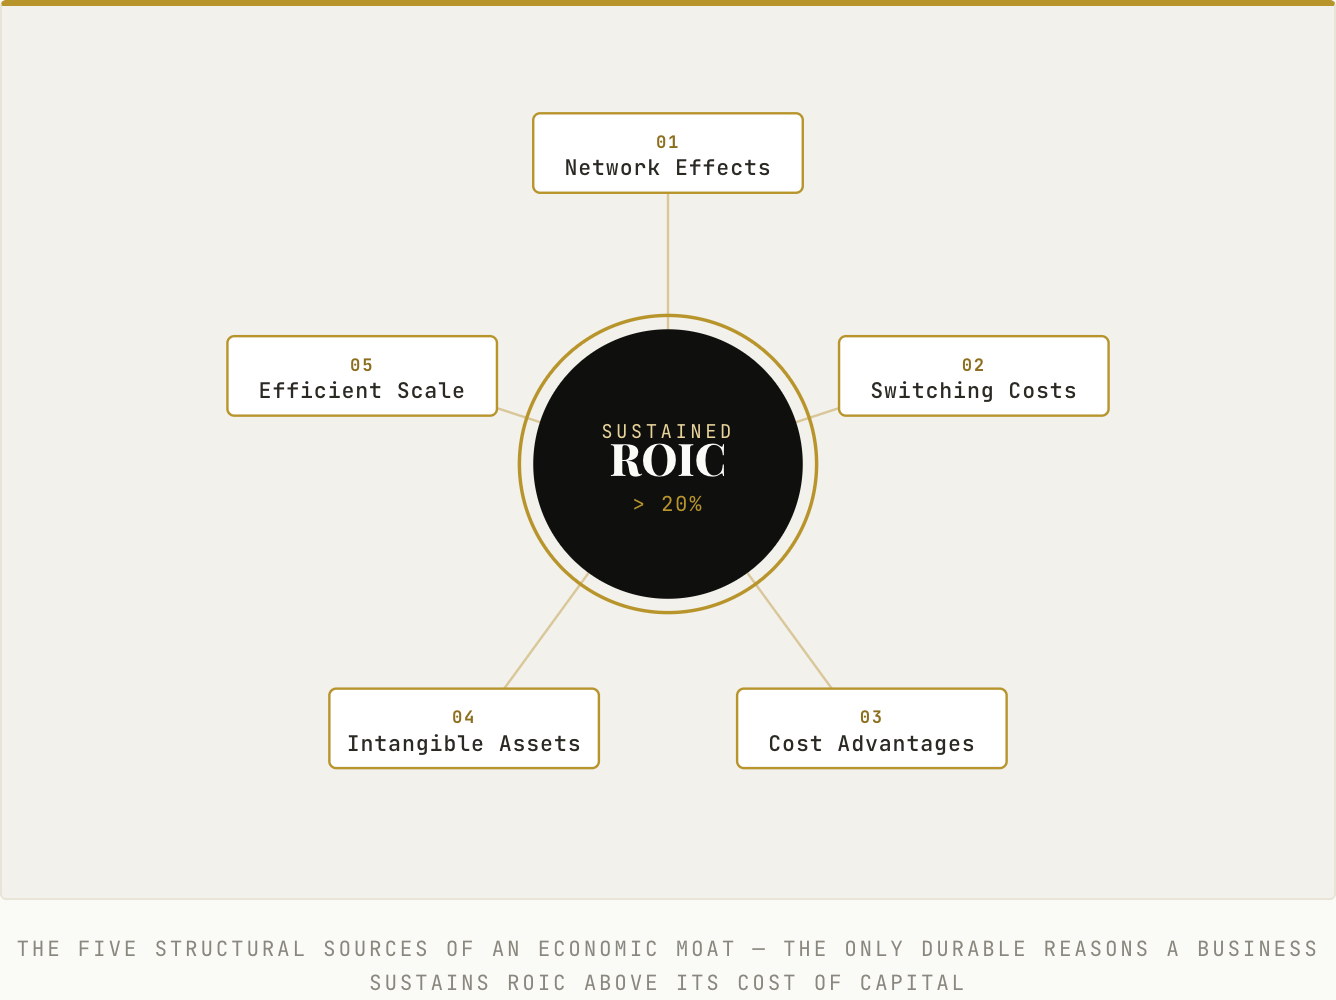
1. Network Effects
A network effect exists when a product becomes more valuable to each user as more users join. This is distinct from scale. Scale lowers cost per unit as volume grows; a network effect raises value per user as the network grows. The protection mechanism is that a new entrant cannot win simply by building a better product — it must also replicate the network itself, and the network does not want to move. A messaging app with one million users is not competing with the incumbent on features. It is competing with the fact that every existing user’s contacts are already somewhere else.
Visa and Mastercard are the cleanest example. More cardholders attract more merchants, which attracts still more cardholders — a two-sided flywheel that has compounded across decades. Visa alone now carries 4.6 billion payment credentials and processed 234 billion transactions in fiscal 2024, worth roughly $16 trillion in total payments and cash volume. A rival cannot court merchants without cardholders or cardholders without merchants, and must solve both sides at once. The depth of this dynamic is examined directly in the Visa vs. Mastercard Head-to-Head. Network effects erode only when a challenger can pull users from both sides of the network simultaneously — which generally requires either a genuinely superior product or an existing platform with a captive user base on one side. That is precisely why a phone maker’s wallet is a credible long-term threat to the card networks in a way that a standalone payment startup never could be.

2. Switching Costs
Switching costs exist when the cost of moving from one vendor to another — measured in time, money, operational disruption, and risk — exceeds the benefit of switching. This is not mere inconvenience. It is structural lock-in that keeps rational customers in place even when alternatives plainly exist. The protection mechanism is subtle but powerful: the customer already paid the switching cost when they first adopted the product, and every additional year of use deepens the integration, the institutional knowledge, and the organizational dependency. The moat grows deeper over time rather than shallower.
Constellation Software’s vertical market software businesses illustrate this well. A municipality that runs permitting, tax collection, and citizen services on the same platform has trained its entire staff around it, built its workflows on top of it, and integrated years of data inside it. Switching would mean years of disruption, retraining, and recertification — for software that may represent a small line item but sits at the center of daily operations. The dynamic is examined in the Constellation Software Bull vs. Bear. The erosion condition is specific: switching costs weaken when automation sharply reduces the procedural cost of migration — when a new system can import legacy data, retrain staff, and replicate workflows faster and more cheaply than before.

3. Cost Advantages
A cost advantage exists when a business can deliver its product at materially lower cost than competitors — not because it happens to be more efficient this year, but because of a structural feature rivals cannot replicate without fundamentally changing their own business model. The protection mechanism is flexibility: a structural cost advantage lets a business price competitively, reinvest in the product, and still earn superior returns — or simply survive a price war that would bankrupt a higher-cost rival. The durable sources are scale economies, proprietary process technology, unique resource access, and network-driven supply efficiencies.
Copart, the salvage vehicle auction operator founded in 1982, owns one of the clearest examples. Its network of more than 280 physical yards, holding over 10,000 acres of inventory near population centers, was assembled over four decades and at historical land prices. A new entrant attempting to build a competing salvage auction network would face land acquisition costs that are multiples of what Copart paid, for a business whose economics depend on owning that land cheaply and densely. The full analysis is in the Copart Deep-Dive. Cost advantages erode when a new technology eliminates the source of the advantage outright — as digital distribution erased the value of physical retail density in category after category.

4. Intangible Assets
Intangible assets create moats when they confer pricing power, regulatory protection, or customer preference that capital alone cannot replicate. Three categories matter most: brands, patents and proprietary technology, and regulatory approvals. The protection mechanism differs by type, and the distinctions are where most analysis goes wrong.
A brand is a moat only when it commands a durable price premium that exceeds the cost of maintaining it, across product cycles and consumer generations. Most brands are not moats; they are marketing expenses with a logo. Regulatory approvals, by contrast, are legally enforced barriers. TransDigm’s FAA Parts Manufacturer Approvals mean that no competitor — regardless of how good its part is — can legally supply a substitute for a certified aircraft component without completing the same costly, time-consuming certification, a barrier to be examined in the future TransDigm Deep-Dive (not yet published). Proprietary data and institutional knowledge form a third category, one that compounds with use; S&P Global’s credit ratings franchise rests on a database of analysis accumulated over more than a century, a depth no new entrant can purchase, detailed in the S&P Global Deep-Dive. Intangible moats erode when brands lose cultural relevance, patents expire without replacement, or regulatory frameworks change — and the most dangerous form of this erosion is gradual, with brand relevance fading slowly while reported results still look healthy.

5. Efficient Scale
Efficient scale occurs when a market is large enough to support one or a few competitors profitably, but not large enough to reward a new entrant who would compete the industry’s returns down to nothing. The incumbents have already scaled to serve the market; a newcomer would face years of losses before reaching the same efficiency — losses that the available market size simply cannot justify. The protection mechanism is unusual among the five, because it is not a feature the business built. It is a feature of the market’s structure that the incumbent happens to occupy.
Major stock exchanges, ratings agencies, and pipeline and airport infrastructure all fit this pattern. The established U.S. equity exchanges serve their market efficiently, and a third entrant would have to build the technology, attract liquidity away from incumbents, and clear regulatory approval — for a market that is already well served. The math does not support the investment, so the investment is not made. Efficient scale erodes when market growth finally makes the entry economics worthwhile, or when a technology shift collapses the capital required to compete.
The five sources are the structural reasons some businesses sustain ROIC far above their cost of capital for decades. A business with no moat source earns high returns only until a competitor notices and deploys capital to take them. A business with one strong source can defend its returns for years. A business with two or three reinforcing sources — switching costs braced by network effects, intangible assets braced by efficient scale — compounds for decades, because a competitor must defeat several overlapping barriers at once. The interaction of these sources, and how to score them, is developed further in the Switching Cost Scorecard.

Section 4
The Test
How to Know if a Moat Is Real — Four Diagnostic Questions
The first question is the most fundamental: would a ten-billion-dollar investment by a rational competitor dislodge this business’s market position within five years? Capital is the most direct competitive attack, and if money alone can solve the problem — hire the engineers, build the factories, buy the customers with better pricing — then the moat is weak or absent, because capital is the one resource markets always eventually supply. The strongest moats are those where capital is necessary but not sufficient. A competitor can spend ten billion dollars assembling a payment network; that spending does not conjure six decades of merchant and cardholder relationships into existence.
The second question is empirical: has ROIC stayed above roughly 20 percent for at least a decade, through at least one full economic cycle? A business that has held high returns through recessions, competitive attacks, and technology transitions is demonstrating moat durability rather than mere moat existence. One strong year reflects timing or position; a strong decade reflects structure, and structure is what an investor is paying for. The reasoning behind this threshold is set out in full in the ROIC piece.
The third question turns to history: when a well-resourced competitor attacked this market, what actually happened? Failed attacks are the strongest available evidence, because they reveal the moat under live fire rather than in theory. Google’s social network, launched with enormous resources, could not overcome the network effect that kept users on the incumbent platform, and it was eventually shut down. A long line of banking apps tried and failed to replicate early consumer payment adoption, revealing how quickly habit and integration harden into switching costs. The failures teach more than the successes, because success can be luck while a pattern of repelled, deep-pocketed attackers is hard to fake.
The fourth question is the one most investors never ask: is the moat getting wider or narrower? A moat is never static. Every year of operation either deepens it — more nodes on the network, more data in the asset, more integrations, more certifications — or erodes it as technology shifts, rivals adapt, and customer preferences move. The disciplined version of this question is twofold: by what specific mechanism does this moat compound, and by what specific mechanism could it erode? If the erosion mechanism is more compelling than the compounding mechanism, the moat is narrowing even if it looks formidable today. That question leads directly to the most important section of this piece.
Section 5
The Trajectory
The Thing Most Moat Analysis Gets Wrong
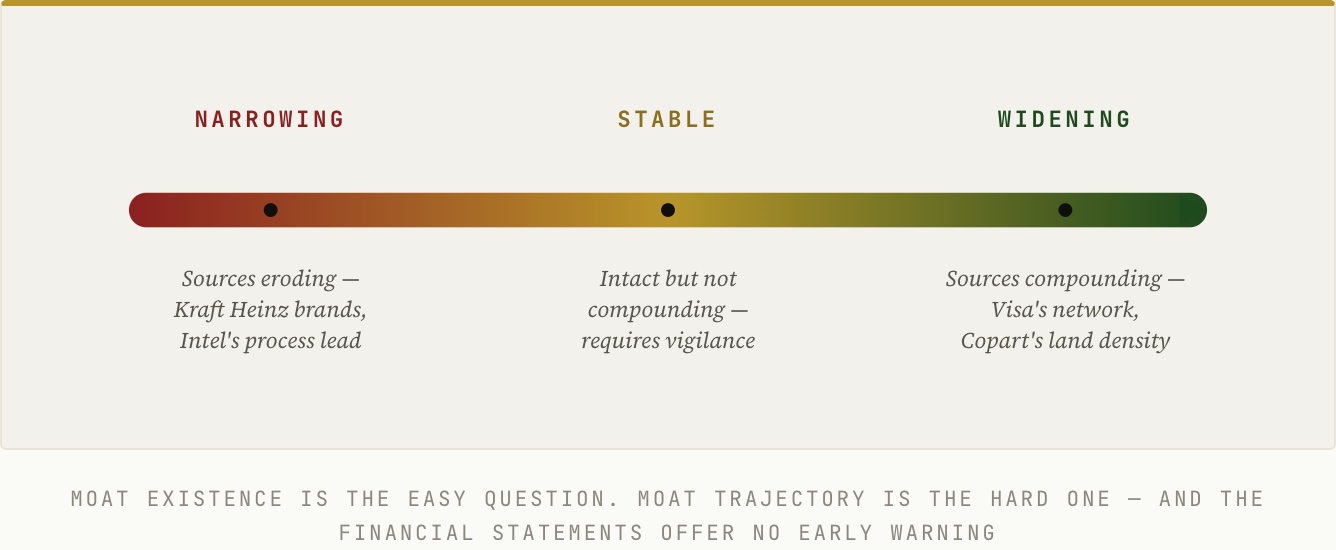
Most moat analysis asks a single question: does this moat exist? That is the easy question, and most investors answer it correctly for the obvious cases. The harder and more important question is whether the moat is widening or narrowing — and most investors get this one wrong, because the signals are subtle, the consequences are delayed, and the financial statements offer no early warning. Moat existence is binary and visible. Moat trajectory is continuous and largely invisible until it is too late.
A widening moat is one whose sources are actively compounding. Each year of operation makes the business harder to displace: the network adds nodes, the switching costs deepen, the data asset lengthens its history, the regulatory position accumulates certifications. Widening moats can be held indefinitely, because for these businesses the passage of time is an ally rather than a threat. A stable moat is intact but not compounding; the business holds its position without meaningfully extending it, which means it requires constant vigilance, because any shift in technology, regulation, or customer behavior that the business fails to absorb will quietly convert a stable moat into a narrowing one.
A narrowing moat is the most dangerous of the three, precisely because it is the hardest to see. The network is shedding nodes, switching costs are falling as migration tools improve, regulatory protections are being challenged, or brand relevance is fading with younger customers. Yet the business still looks strong: revenue grows, margins hold, free cash flow remains abundant. The structural protection is diminishing while the reported numbers stay healthy, and the market typically refuses to price the erosion until the financials finally break — which can lag the moat’s decline by years.
Intel is the instructive case. For most of its history, Intel’s moat rested on undisputed leadership in semiconductor manufacturing process technology. That leadership began slipping in the second half of the last decade, as Intel repeatedly delayed its next-generation process while Taiwan Semiconductor advanced past it and seized the manufacturing lead for the first time in a generation. None of this was visible in the financials. Intel posted its fifth consecutive year of record revenue in 2020 — $77.9 billion, with $21.1 billion of free cash flow — even as the structural foundation of its moat was already eroding. The reported numbers peaked at almost exactly the moment the moat had narrowed most, and the deterioration only reached the income statement years later. An investor reading the financials alone would have seen a fortress. An investor assessing the moat’s trajectory would have seen a fortress being undermined from below.
The discipline this demands is simple to state and hard to practice. For every moat source identified in a business, ask one further question: what is the primary mechanism by which this source could erode over the next decade? If that mechanism is already active — if technology, regulation, or customer behavior is already moving against the moat — the trajectory is narrowing. If the mechanism is theoretical but dormant, the trajectory is stable. And if the opposite holds, if the passage of time deepens each source, the trajectory is widening. Widening moats available at reasonable valuations are the rarest and most valuable asset in markets.
Section 6
The Danger Zone
A Narrowing Moat at a High Multiple Is the Most Dangerous Position in Markets
A narrowing moat at a high multiple is one of the most dangerous positions in markets — and the danger comes specifically from the combination, not from either condition alone. A narrowing moat in a cheap stock can still produce an acceptable outcome, because the low price already embeds modest expectations. A high multiple on a widening moat can be justified by the decades of compounding ahead. It is the intersection — a high price resting on a structure that is quietly weakening — that destroys capital.
The mechanism is double compression. A high multiple is, by definition, the market’s expectation of sustained high returns on capital far into the future. A narrowing moat means the structural protection for those returns is weakening. As the moat erodes, two things deteriorate at once: the returns themselves fall, and the multiple the market is willing to pay collapses as the deterioration becomes undeniable. A business earning 25 percent ROIC at 35 times earnings can hand shareholders a catastrophic loss if ROIC slides to 15 percent while the multiple compresses from 35 to 20 at the same time. The two effects multiply rather than add.
This situation is common precisely because high multiples attract attention, coverage, and conviction. Businesses with deteriorating moats tend to look excellent in the short run — revenue growth, margin expansion, and cash generation can all persist for years after the structural erosion begins, often flattered by cost-cutting that masks the underlying decay. The multiple is therefore highest at the exact moment the deterioration is least visible, because investors are extrapolating a strong past into a future whose foundation is already cracking.
Kraft Heinz is the textbook example, and the more painful because one of the most disciplined investors in the world was caught in it. Built through the 2015 merger and held by Berkshire Hathaway and 3G Capital, the company was treated as a portfolio of unassailable brands — an intangible-asset moat. But that moat had been narrowing for years, as private-label competition intensified and consumer preferences shifted toward fresher and healthier options, while aggressive cost-cutting propped up margins and disguised the erosion. The reckoning arrived on February 22, 2019: Kraft Heinz disclosed a write-down of roughly $15 billion on its Kraft and Oscar Mayer brands, slashed its dividend, and revealed an SEC investigation. The stock fell about 28 percent in a single day, erasing some $16 billion of market value. Warren Buffett later acknowledged plainly that Berkshire had overpaid, and in the decade after the merger the company shed more than $57 billion in market capitalization. The brands looked durable on the income statement right up until the moment the market concluded they were not.
The implication for portfolio construction is direct. Moat trajectory assessment is not optional. A position in a business with a narrowing moat — however impressive that moat looks today — requires either a specific, defensible thesis for why the erosion will reverse, or an entry valuation low enough to provide a margin of safety against the deterioration. At a high multiple, neither condition is usually met. The AI Moat Analysis published earlier this year applied exactly this trajectory framework to a universe of quality compounders, assessing specifically which moats are widening and which are narrowing under pressure from artificial intelligence.

Section 7
The Universe
The Businesses That Pass the Moat Test — and What They Have in Common
When the full framework is applied with discipline — five sources, trajectory assessment, and the danger-zone test — the universe of businesses worth owning for the long term shrinks dramatically. Most public companies have no durable moat source at all. A meaningful number have a moat that is quietly narrowing. The genuinely exceptional businesses, the ones worth studying in depth, share a small set of traits: two or more reinforcing moat sources, all of which are widening rather than holding or fading.
The first trait is that they are hard to describe simply, and often boring from the outside. The deepest moats tend to sit in unglamorous markets — salvage auctions, vertical market software, aerospace components, payment infrastructure. The moat is not found in the excitement of the product. It is found in the structural position the business occupies within its specific market, a position that took decades to build and cannot be photographed or demoed.
The second trait is that their competitors have stopped trying. The clearest signal of a wide moat is a market where well-resourced rivals attacked, failed, and gave up. When a networking giant cannot displace a specialized challenger in high-speed cloud data-center switching after years of effort, that is evidence the challenger’s position is structural. When no strategic buyer or private equity firm can recreate Copart’s land network regardless of the capital available, that is evidence the cost advantage is real. The absence of credible attackers is more informative than any management narrative.
The third trait is that their returns have been sustained, not merely achieved. A business that earned 30 percent ROIC for a year or two may simply have been fortunate. A business that has earned 25 percent or more for fifteen years, across recessions and technology transitions, has demonstrated the kind of structural protection that is worth paying a fair price to own. Duration is the proof; a single great year proves nothing.
Return on invested capital identifies the businesses that create value. Owner earnings measures what owners actually receive. The moat framework explains why some businesses sustain those returns for decades while competition erodes them for everyone else. Together, these three concepts form the foundation of every piece of paid research published here — applied to specific companies, with specific financial evidence and specific price targets. The case for ROIC is laid out in full in the ROIC piece, and the trilogy is completed by the Owner Earnings piece.

Quality Equities publishes independent research for informational purposes only. Nothing published constitutes investment advice or a recommendation to buy or sell any security. The author may hold positions in securities discussed.